Construction Manager Salary in Minnesota: $127,646 (2026)
Quick Answer:Across Minnesota's 44 metropolitan areas, the average median construction manager pay sits at $127,646/year heading into 2026 — a figure projected from 2025 BLS OEWS wage data for SOC 11-9021. Because Minnesota sits at BEA RPP 98.5 (1% below the U.S. baseline), that statewide median translates to roughly $129,590 in nationally-comparable purchasing power. Highest-paying metros: Minneapolis ($126,920), St. Paul ($125,646), Bloomington ($124,671).
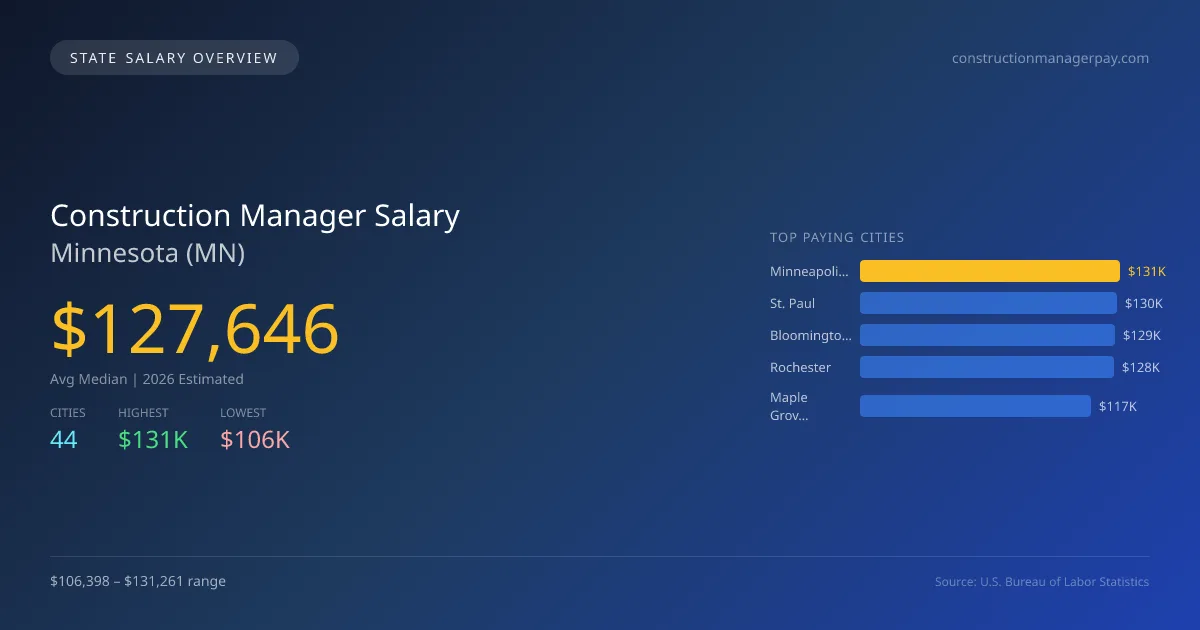
In 2026, construction managers in Minnesota are projected to earn an average median salary of $127,645, which is 7.3% higher than the national median salary of $118,923. The city of Minneapolis offers the highest salaries at $131,261, while Mankato reports the lowest at $106,398. This difference of $24,863 is influenced by local demand for construction projects, cost of living, and the concentration of larger firms in metropolitan areas like Minneapolis and St. Paul, where salaries are also high at $129,943 and $128,935, respectively. Minnesota has specific licensing requirements and scope of practice laws that must be adhered to, ensuring that construction managers possess the necessary credentials to operate effectively within the state. Additionally, the construction job market in Minnesota is projected to grow at an annual rate of 3.42% through 2026, fueled by ongoing infrastructure development and a rising demand for residential and commercial projects. With 5,182 construction managers currently employed in the state, the outlook remains stable, suggesting ample opportunities for skilled candidates in the coming years. This environment, combined with competitive salaries, indicates a favorable context for professionals in this field.
Minnesota Construction Manager Salary Range
Overall salary range in Minnesota: $64,700 (lowest entry-level) to $205,278 (highest top earner)
Minnesota vs National Average
Minnesota construction managers earn 7.33% more than the national median (+$8,723/year difference).
Minnesota Construction Manager Salary Distribution (2026)
Construction Manager salaries in Minnesota range from $81,120 (entry-level, 10th percentile) to $197,466 (top earners, 90th percentile), with a median of $127,646. The Minnesota median is $8,723 above the US national median of $118,923. The average hourly rate is $61.37/hr. Approximately 5,182 construction managers are employed across 44 cities.
2019 BLS Actual
$94,616
2025 BLS Actual
$123,424
2026 Current Est.
$127,646
2019–2027 Growth
+39.5%
Salary Trajectory for Construction Managers in Minnesota (2019–2027)
2019–2025: actual BLS OEWS data for this metro area. 2026+: CAGR 3.42% projection.
| Year | Annual Salary | Status |
|---|---|---|
| 2019 | $94,616 | Actual |
| 2020 | $94,423 | Actual |
| 2021 | $98,358 | Actual |
| 2022 | $98,902 | Actual |
| 2023 | $104,167 | Actual |
| 2024 | $117,503 | Actual |
| 2025 | $123,424 | Actual |
| 2026(current) | $127,646 | Estimated |
| 2027 | $132,011 | Projected |
Based on 7 years of BLS OEWS data for the Minnesota metropolitan area, the median construction manager salary grew 30.4% from $94,616 (2019) to $123,424 (2025). At a 3.42% compound annual growth rate, salaries are projected to reach $132,011 by 2027 — a total increase of $37,395 (39.52%) from 2019.
Note: Historical values (2019–2025) are actual BLS OEWS figures for the Minnesota metropolitan area, sourced from annual Occupational Employment and Wage Statistics surveys. 2026–2026 figures are current estimates, and 2027 values are projections, calculated using a 3.42% CAGR derived from 7-year BLS historical data. Actual salaries may vary based on employer, experience, certifications, and local market conditions.
Top 5 Highest Paying Cities in Minnesota
Lowest Paying Cities in Minnesota
Best Value Cities for Construction Managers in Minnesota
When adjusted for local cost of living, these Minnesota cities offer the most purchasing power for construction managers.
| City | Nominal Salary | CoL Index | Adjusted Salary |
|---|---|---|---|
| Rochester | $128,282 | 90.821 | $141,247 |
| St. Paul | $129,943 | 98.5 | $131,922 |
| St. Cloud | $115,086 | 87.632 | $131,329 |
| Bloomington | $128,935 | 98.5 | $130,898 |
| Duluth | $112,707 | 88.768 | $126,968 |
Adjusted salary = nominal salary × (100 / CoL index). CoL index: 100 = national average. Lower index = lower cost of living.
Salary by Experience Level in Minnesota
| Experience Level | Estimated Annual |
|---|---|
| Entry Level (0-2 years) | $81,120 |
| Mid Career (3-7 years) | $127,646 |
| Experienced (7+ years) | $197,466 |
Estimates based on BLS percentile data averaged across Minnesota metro areas. Individual pay varies by employer, certifications, and specialization.
All 44 Cities in Minnesota
| # | City | Median Salary |
|---|---|---|
| 1 | Minneapolis | $131,261 |
| 2 | St. Paul | $129,943 |
| 3 | Bloomington | $128,935 |
| 4 | Rochester | $128,282 |
| 5 | Maple Grove | $116,646 |
| 6 | Woodbury | $116,601 |
| 7 | Eden Prairie | $116,491 |
| 8 | St. Cloud | $115,086 |
| 9 | Owatonna | $114,245 |
| 10 | Brooklyn Park | $114,094 |
| 11 | Plymouth | $113,894 |
| 12 | Roseville | $113,826 |
| 13 | Chaska | $113,736 |
| 14 | Minnetonka | $113,711 |
| 15 | Cottage Grove | $113,584 |
| 16 | Burnsville | $113,493 |
| 17 | Lakeville | $113,073 |
| 18 | Chanhassen | $112,995 |
| 19 | Inver Grove Heights | $112,817 |
| 20 | Eagan | $112,800 |
| 21 | Brooklyn Center | $112,772 |
| 22 | Elk River | $112,754 |
| 23 | Duluth | $112,707 |
| 24 | Prior Lake | $112,638 |
| 25 | Ramsey | $112,227 |
| 26 | Blaine | $111,752 |
| 27 | Apple Valley | $111,579 |
| 28 | Shakopee | $111,468 |
| 29 | Coon Rapids | $111,452 |
| 30 | Savage | $111,272 |
| 31 | Edina | $111,259 |
| 32 | Maplewood | $110,932 |
| 33 | Andover | $110,906 |
| 34 | Richfield | $110,852 |
| 35 | St. Louis Park | $110,842 |
| 36 | Moorhead | $110,682 |
| 37 | Northfield | $109,882 |
| 38 | Hastings | $109,648 |
| 39 | Fridley | $109,155 |
| 40 | Winona | $109,066 |
| 41 | Shoreview | $109,021 |
| 42 | Austin | $108,852 |
| 43 | Faribault | $108,713 |
| 44 | Mankato | $106,398 |
More Minnesota Salary Data
Hourly Rates
Explore construction manager hourly pay in Minnesota cities.
Senior / Experienced
Top earner salaries for experienced construction managers.
Compare Cities in Minnesota
View all comparisons →Explore More Construction Manager Salary Data
Frequently Asked Questions
How much do construction managers make in Minnesota in 2026?
What is the highest paying city for construction managers in Minnesota?
How does Minnesota construction manager pay compare to the national average?
What is the entry-level construction manager salary in Minnesota?
How many construction managers are employed in Minnesota?
Which Minnesota city offers the best value for construction managers?
Written by Michael Johnson, MS, CCM
Career Analyst
Michael has 10 years of experience in construction management. He specializes in project scheduling and cost control. He works with a mid-sized general contracting firm.
Methodology & Data Source
Statewide salary figures on this page are 2026 projections based on the Bureau of Labor Statistics Occupational Employment and Wage Statistics (OEWS) survey, May 2026 release. A 3.42% compound annual growth rate (CAGR), derived from 6-year national BLS wage trends, was applied to each metro area's reported salary to estimate current 2026 construction manager compensation across Minnesota. State averages are employment-weighted across 44 metro areas — larger metro areas with more construction managerscontribute proportionally more to the average, producing figures that better reflect typical compensation. Individual pay varies by city, employer, certifications, and experience.
Data Sources & Methodology
Source: BLS, OEWS, 7-year dataset (–). Per-city data from annual BLS metropolitan area surveys.
2026 figures are projected from 2025 BLS data using a compound annual growth rate (CAGR) of 3.42%, derived from historical BLS wage trends for construction managers (SOC 11-9021).
Compiled and verified by Michael Johnson, MS, CCM, a licensed construction manager with 10+ years of clinical experience. · View source data at BLS.gov